
Price Tracking Tools: What They Can and Can't Tell You

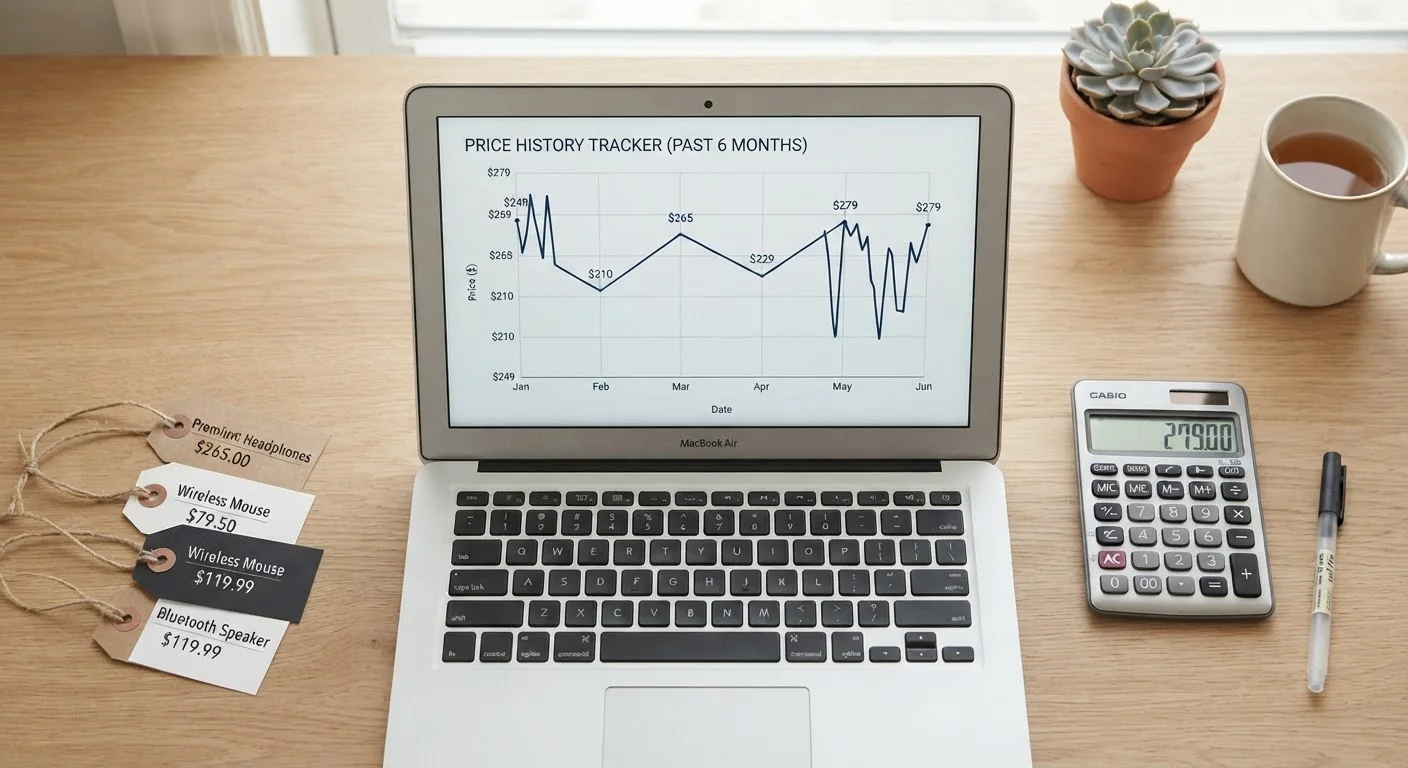
Photo: InDepthReads.com | Streamlining Learning For All editorial
Key Takeaways
- Price tracking tools show historical data, not guaranteed future prices.
- Retailers can manipulate reference prices, making 'deal' signals misleading.
- Tracking tools work best on stable, commodity-like products with long sales histories.
- Data gaps and retailer-specific pricing limit what these tools can reliably show.
- Use price history as one input alongside context — not as the final word on value.
Exposes inflated 'original' reference prices instantly
A price history chart can show when a retailer has only briefly charged the higher 'was' price, revealing that a claimed discount is largely artificial.
Helps identify genuine low-price windows
For products with predictable pricing cycles — like electronics around major sales events — historical data can show when a price is genuinely below its typical range.
Free and widely accessible
Most reputable price tracking tools are free to use and require no special setup beyond a browser extension or a quick web lookup, making them accessible to any online shopper.
Reduces impulse purchases triggered by urgency tactics
Seeing months of price data counters the psychological pressure of 'limited time' framing, giving shoppers a factual basis for deciding whether to act immediately.
Data can be gamed by strategic price manipulation
Retailers can briefly list items at artificially high prices to set a favorable baseline, and tracking tools record those prices without any flag or qualification.
Product listing changes go largely undetected
When a product's contents or specifications change under the same URL, the price chart treats old and new versions as identical, making comparisons unreliable.
Coverage gaps distort the picture
Tools only track the retailers they monitor, meaning the 'history' you see may represent one seller's pricing behavior rather than a true market range.
Limited data on newer or niche products
Products with short sales histories or limited retail distribution simply don't have enough tracked data to yield meaningful trend analysis.
Shows price, not value or quality
A low price relative to history doesn't indicate the product is well-made, appropriate for your needs, or a better choice than alternatives at a different price point.
What Price Tracking Tools Actually Do
Price tracking tools — browser extensions, dedicated websites, and retailer-integrated features — log the listed price of a product over time and display that data as a chart. When you look up an item, you can see whether today's price is higher, lower, or roughly the same as it has been over weeks or months.
Most tools pull data from major online retailers automatically, recording price snapshots at regular intervals. The resulting charts let shoppers answer a basic question: is this price actually unusual, or is it roughly what this item always costs?
That's a genuinely useful function. Manufactured urgency and inflated reference prices are common retail tactics, and a price history chart can quickly expose a "40% off" claim that's built on a rarely-charged original price. For that specific use case, these tools earn their place in a shopper's toolkit.
Exposes inflated 'original' reference prices instantly
A price history chart can show when a retailer has only briefly charged the higher 'was' price, revealing that a claimed discount is largely artificial.
Helps identify genuine low-price windows
For products with predictable pricing cycles — like electronics around major sales events — historical data can show when a price is genuinely below its typical range.
Free and widely accessible
Most reputable price tracking tools are free to use and require no special setup beyond a browser extension or a quick web lookup, making them accessible to any online shopper.
Reduces impulse purchases triggered by urgency tactics
Seeing months of price data counters the psychological pressure of 'limited time' framing, giving shoppers a factual basis for deciding whether to act immediately.
The Real Limitations You Need to Know
Price history data is only as reliable as what retailers choose to publish — and that creates several structural problems.
Retailers can adjust reference prices. Some sellers briefly list a product at an inflated price to establish a high baseline, then discount it. The tracking tool records both prices faithfully, potentially making a routine price look like a significant drop. This connects directly to how MSRP functions as a pricing anchor — a high reference point shapes perception even when it doesn't reflect real market value.
Product variants complicate comparisons. Retailers sometimes update product listings — changing bundle contents, sizes, or formulations — while keeping the same listing URL. A price drop that looks compelling may actually reflect a smaller or different version of the product.
Data coverage varies widely. Tools typically track only the retailers they have access to. A price that looks high on one platform might be standard elsewhere. Gaps in tracking history, especially for newer products, mean the chart may not show enough data to draw meaningful conclusions.
Data can be gamed by strategic price manipulation
Retailers can briefly list items at artificially high prices to set a favorable baseline, and tracking tools record those prices without any flag or qualification.
Product listing changes go largely undetected
When a product's contents or specifications change under the same URL, the price chart treats old and new versions as identical, making comparisons unreliable.
Coverage gaps distort the picture
Tools only track the retailers they monitor, meaning the 'history' you see may represent one seller's pricing behavior rather than a true market range.
Limited data on newer or niche products
Products with short sales histories or limited retail distribution simply don't have enough tracked data to yield meaningful trend analysis.
Shows price, not value or quality
A low price relative to history doesn't indicate the product is well-made, appropriate for your needs, or a better choice than alternatives at a different price point.
Where These Tools Add the Most Value
Price trackers perform best on commodity-like products with long, stable sales histories: electronics, household staples, and widely distributed goods sold by multiple major retailers. For these items, months of consistent pricing data give you a credible baseline.
They're least reliable for fast-fashion items, seasonal goods, limited-edition products, or anything sold primarily through a single retailer with control over its own pricing history. For those categories, the chart may show only what one seller decided to charge — not what the item is worth in any broader sense.
Not All Retailers Are Tracked Equally
Understanding the mechanics behind common retail pricing strategies adds important context to whatever a price chart shows. Historical data and pricing-tactic awareness work better together than either does alone.
Using Price Data Without Overreading It
The most practical approach is to treat price history as a filter, not a verdict. If a chart shows a product has consistently sold for $45 and today's price is $44, there's no meaningful deal to act on. If it shows the item has never been below $60 and today's price is $48, that's worth noting — though it still doesn't tell you whether you need the item or whether a comparable product might cost less elsewhere.
Sale tag fine print and price history charts address the same underlying question from different angles: is this price what it claims to be? Using both, alongside basic comparison shopping, gives you a more complete picture than any single tool can provide.
~60%
Products with artificially inflated list prices
A ProPublica investigation found that a majority of Amazon 'deals' during Prime Day had reference prices that were rarely or never actually charged at that level.
6–12 months
Minimum history for reliable trend analysis
Consumer pricing analysts generally recommend at least six to twelve months of tracked data before drawing conclusions about whether a price represents a genuine low.
For shoppers working within a defined budget, price tracking can also support spending discipline — confirming that a purchase reflects fair market value rather than an impulse triggered by marketing language. For broader budgeting context, see budgeting fundamentals.
The content on this site is for informational purposes only and is not a substitute for professional advice. Always consult a qualified professional for guidance specific to your situation.